

HSY Flashes a Doji!
HSY Flashes a Doji!
4/30 Doji & Marubozu S&P 500 Power Scan

Hello and welcome back!
Today, we’re detecting Doji and Marubozu candlestick patterns within the S&P 500. This overview details every S&P 500 stock exhibiting Doji or Marubozu patterns today, anchored in the foundational concepts of candlestick theory.
Be sure to understand the basic characteristics of Doji and Marubozu candlesticks before continuing:
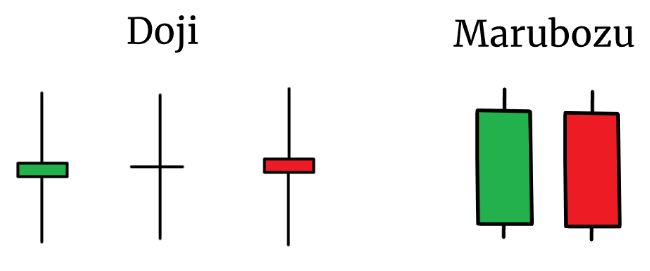
Candlestick patterns depict the dynamic struggle between buyers and sellers, reflecting how the market responds to fluctuations in price over a given time frame. A bullish candlestick emerges when buyers dominate, indicating rising prices; on the other hand, when sellers prevail, a bearish candlestick appears, signaling falling prices. Keep an eye out for our in-depth analysis of notable stocks today.
Flight Mechanics
We identified Doji Candlesticks using a screener in Visual Studio code, applying a length setting of 20 and a body factor of 0.05. For a better understanding of these parameters, don't miss our Doji Debrief. Additionally, we're employing a 9-day Simple Moving Average (SMA) to refine our evaluation of Bearish and Bullish Doji Candlesticks.

For Marubozu candlesticks, our Visual Studio code screener was set with a length of 20 and a body factor of 0.01. Ensure you're acquainted with our Marubozu Breakdown, which provides a comprehensive explanation of the criteria for these candlesticks.
Hershey Flashes a Doji!
The Hershey Company (HSY), a renowned chocolatier and confectionery manufacturer, plays a significant role in the consumer goods sector of the stock market. As a major producer of chocolate and various sweet treats, Hershey's performance often reflects broader consumer spending habits and economic trends, making it a key player in both the food industry and stock market dynamics.

The Missing Marubozu Candlesticks
Marubozu candlesticks are strong indicators of bullish or bearish sentiment, characterized by a full body with little to no shadows, signifying that the session opened and closed either near the high or low. The absence of Marubozu candlesticks in today's trading session could be a reflection of market indecision where neither bulls nor bears are in full control, leading to more mixed or neutral candlestick formations. This can often occur on days when traders are cautious, potentially due to awaiting key economic reports or news that could impact market directions. Volatility within the session, where prices swing widely from highs to lows, can also prevent the formation of clear Marubozu patterns.
Additionally, the presence of strong technical resistance or support levels can influence the formation of Marubozu candlesticks. When prices reach these key levels, reversals or hesitations in price movement are common, which disrupts the potential for forming a Marubozu candlestick. Balanced trading volumes where buying and selling pressures are equally matched often result in the creation of more complex candlestick patterns, rather than the straightforward buying or selling momentum needed for Marubozu candlesticks. Thus, the blend of these factors in today’s market conditions could easily lead to the absence of these particular patterns, indicating a more varied trading sentiment among participants.
Doji’s Today
Below, the collection of identified Doji Candlesticks is illustrated:

As stated previously, no stocks flashed a Marubozu today.
Thank you for joining us today! As you look forward to tomorrow's Candlestick Pilot, we invite you to explore our article on the Federal Reserve's March interest rate adjustments and what they mean for investors.
Be sure to trade smart and stay sharp! Until next time!
(Please note: This article is for informational purposes only and should not be construed as financial advice.)