

NFLX Flashes a Doji!
NFLX Flashes a Doji!
4/29 Doji & Marubozu S&P 500 Power Scan

Happy Monday!
Let’s kick off the week as we search for Doji and Marubozu candlestick patterns within the S&P 500. This overview details every S&P 500 stock exhibiting Doji or Marubozu patterns today, anchored in the foundational concepts of candlestick theory.
Be sure to understand the basic characteristics of Doji and Marubozu candlesticks before continuing:
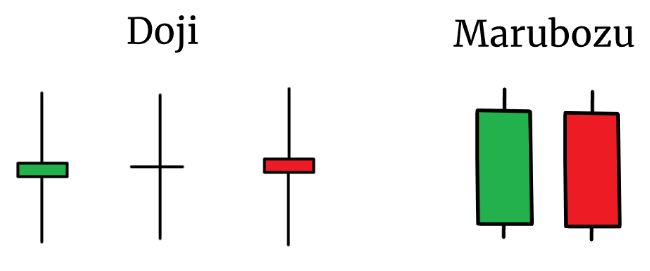
Candlestick patterns depict the dynamic struggle between buyers and sellers, reflecting how the market responds to fluctuations in price over a given time frame. A bullish candlestick emerges when buyers dominate, indicating rising prices; on the other hand, when sellers prevail, a bearish candlestick appears, signaling falling prices. Keep an eye out for our in-depth analysis of notable stocks today.
Flight Mechanics
We identified Doji Candlesticks using a screener in Visual Studio code, applying a length setting of 20 and a body factor of 0.05. For a better understanding of these parameters, don't miss our Doji Debrief. Additionally, we're employing a 9-day Simple Moving Average (SMA) to refine our evaluation of Bearish and Bullish Doji Candlesticks.

For Marubozu candlesticks, our Visual Studio code screener was set with a length of 20 and a body factor of 0.01. Ensure you're acquainted with our Marubozu Breakdown, which provides a comprehensive explanation of the criteria for these candlesticks.\
NFLX Flashes a Doji!
Netflix (NFLX) is a major player in the stock market, primarily known for its substantial influence in the technology and entertainment sectors. As a component of the NASDAQ-100 and S&P 500 indices, its stock performance is often viewed as an indicator of both the health of the streaming industry and broader market trends.
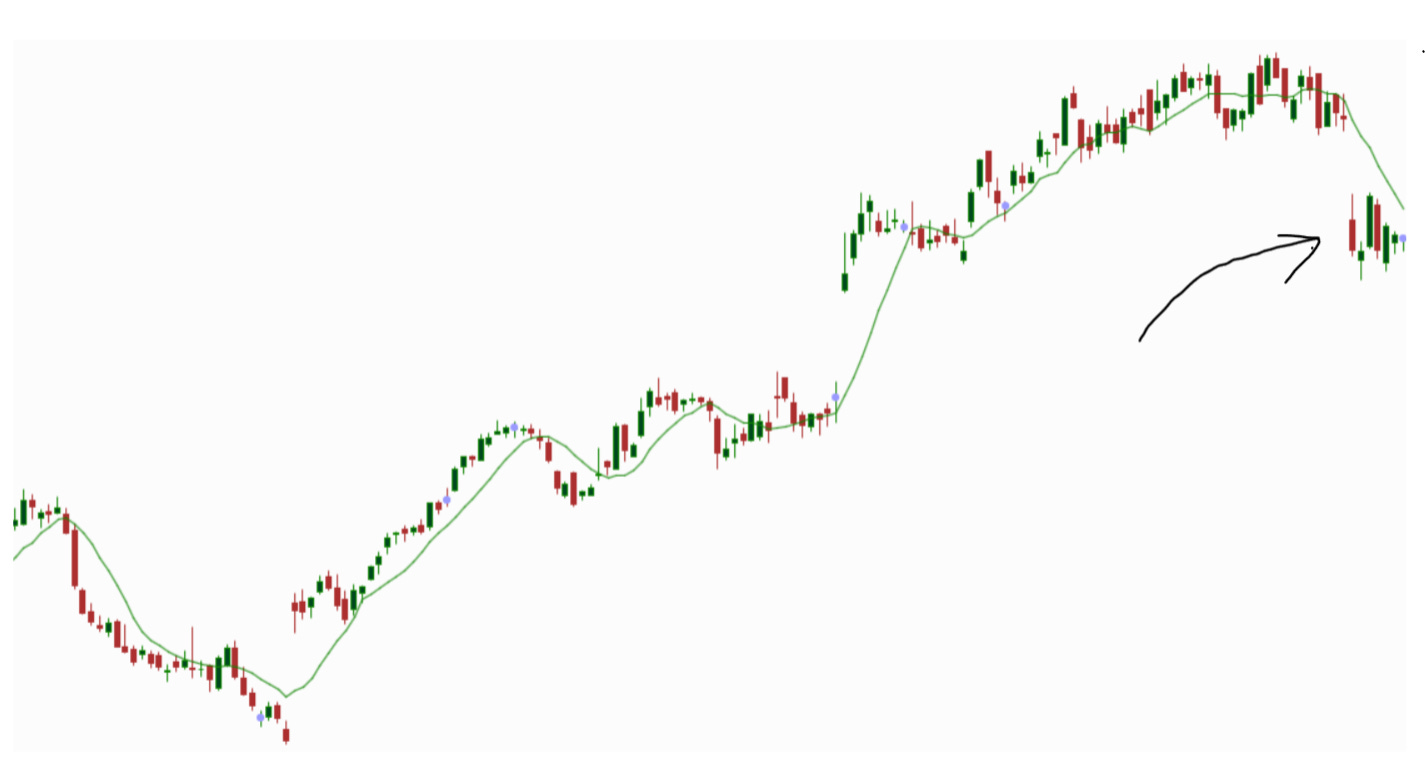
NFLX’s Doji candlestick positioned below the SMA is classified as a bullish Doji, suggesting a potential shift from a bearish to a bullish trend. This pattern typically occurs when selling pressure begins to wane and buyers start to gain control, indicating a possible increase in the stock's price. Such a shift could be driven by positive market news, robust earnings reports, or broader market recovery, enticing investors to capitalize on the anticipated upward movement.
ATO Flashes a Marubozu!
Atmos Energy Corporation (ATO) is a key player in the utilities sector, primarily engaged in the distribution and storage of natural gas. Known for its stable performance and dividend yields, ATO is considered a reliable investment within the energy sector, reflecting broader economic conditions and energy consumption trends.
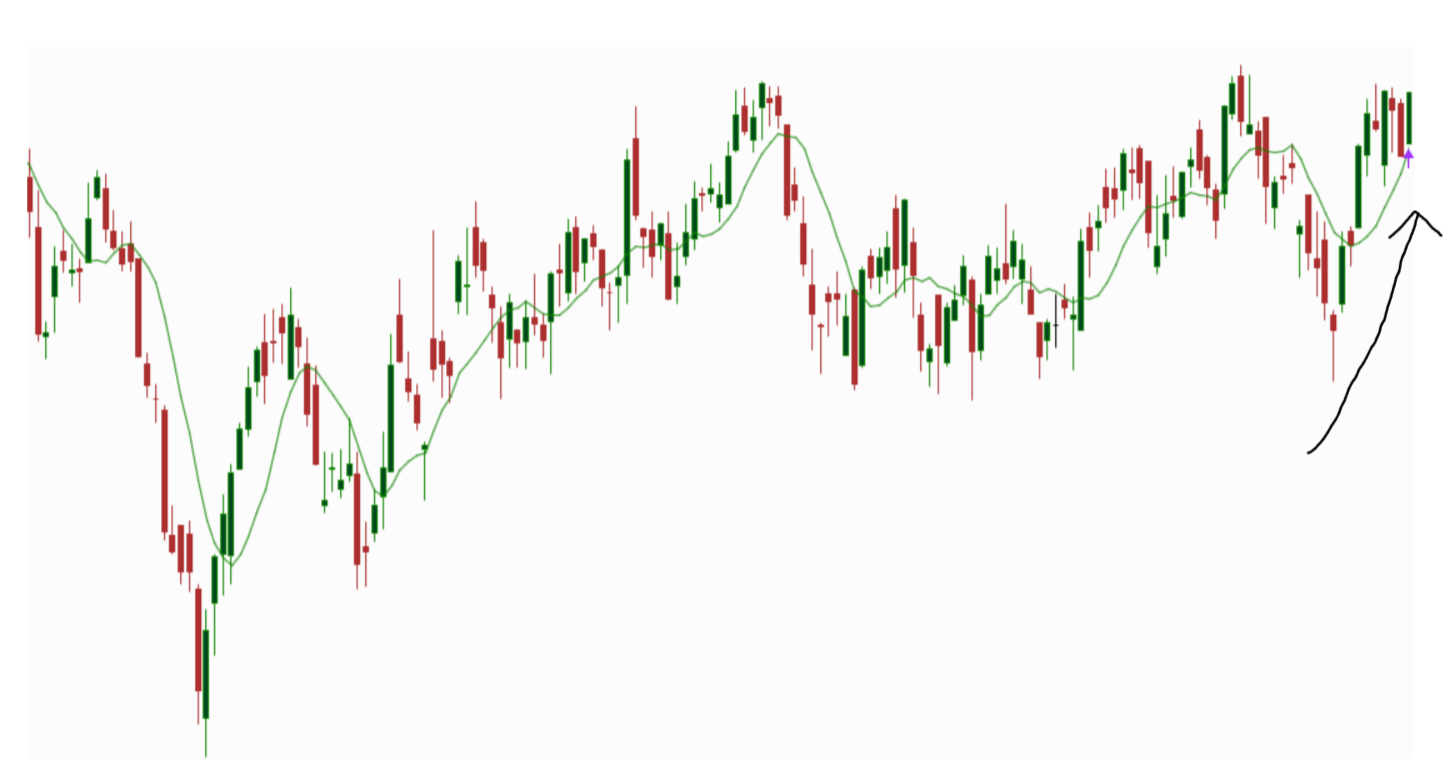
A bullish Doji pattern in ATO’s stock could signal a potential reversal from a bearish to a bullish trend. This pattern suggests that despite trading volatility and indecision during the session, buyers managed to push the closing price back up to near the opening level, indicating growing bullish sentiment and the possibility of an upward price movement in the near future.
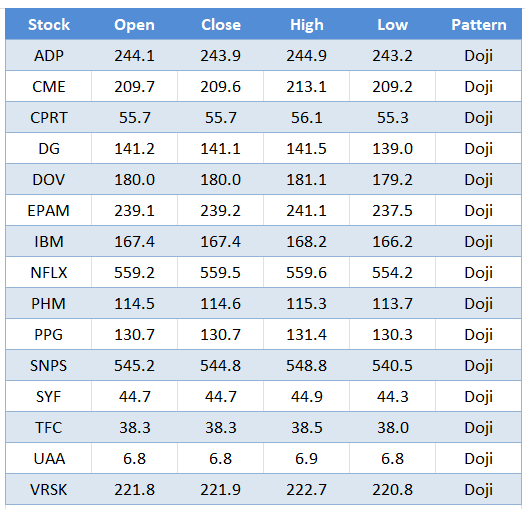
Candlesticks Today
Below, the collection of identified Doji Candlesticks is illustrated:
As stated previously, only ATO flashed a Marubozu Candlestick.
Thank you for tuning in today! While you wait for tomorrow’s Candlestick Pilot, check out our article on The Federal Reserve’s March Interest Rate adjustments and their implications on investors:
Be sure to trade smart and stay sharp! Until next time!
(Please note: This article is for informational purposes only and should not be construed as financial advice.)