What is K-Means Clustering?
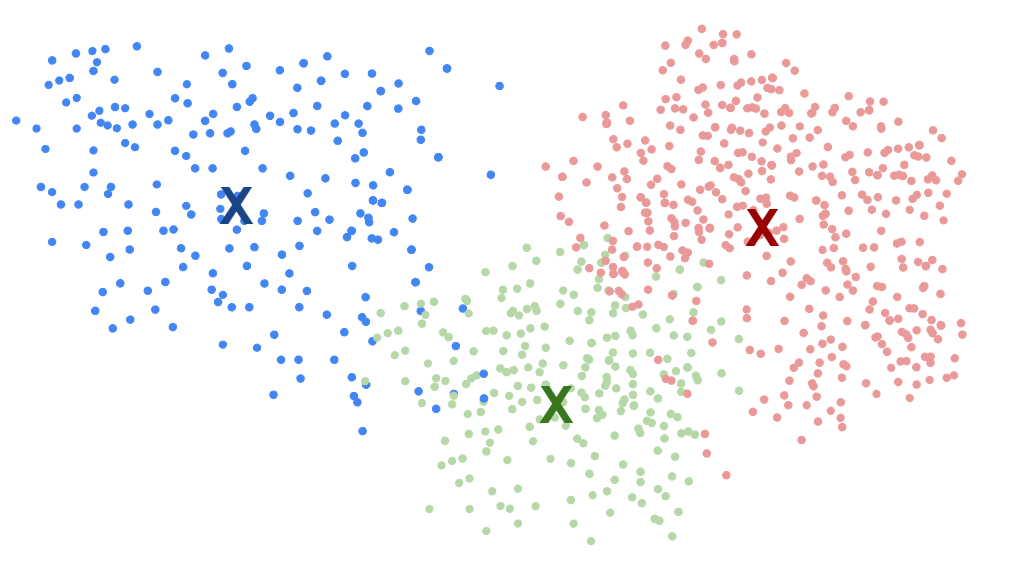
K-means is an algorithm that partitions a dataset into a specified number of clusters, each represented by a centroid. As you might’ve guessed, in this unsupervised learning strategy, “k” is a vital number! “K” represents the number of clusters or groups desired and the importance of selecting an appropriate value of “k” based on the dataset's nature and intended analysis goals.
Vocabulary and Overview
Before we dive deeper, lets go over some vital vocabulary and terminology:
Centroid
In k-means clustering, each cluster is represented by a central point known as a centroid.
The centroid is the mean position of all the data points within a cluster. In other words, it is the point where the distances to all other points in the cluster are minimized.
The centroid itself doesn’t have to be a data point from the dataset but is instead a calculated position that reflects the cluster’s center.
Distance Measure (Euclidean Distance)
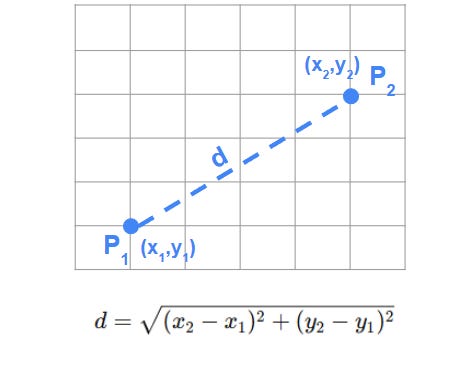
Euclidean Distance is the most commonly used metric in k-means clustering to determine how close or similar two points are.
The Euclidean distance between two points in a multi-dimensional space is the straight-line distance between them, calculated as the square root of the sum of squared differences between corresponding coordinates.
This measure of distance is used by k-means to assign data points to the cluster with the closest centroid, ensuring that points are grouped by proximity.
The K-Means Clustering system is carried out with the five following general steps:
Choosing the Number of Clusters (k)
Initializing Centroids
Assigning Data Points to the Nearest Centroid
Updating Centroids
Iterating Until Convergence
Choosing the Right Number of Clusters
The algorithm starts by determining the number of clusters, k. Selecting an optimal value for k can be challenging; techniques such as the Elbow Method or Silhouette Score are often used to evaluate different values and determine the best number of clusters based on the dataset’s characteristics. You can read deeply into those methods below:
We’ll provide a brief overview in today’s edition of Investor’s Edge as well.
The Elbow Method
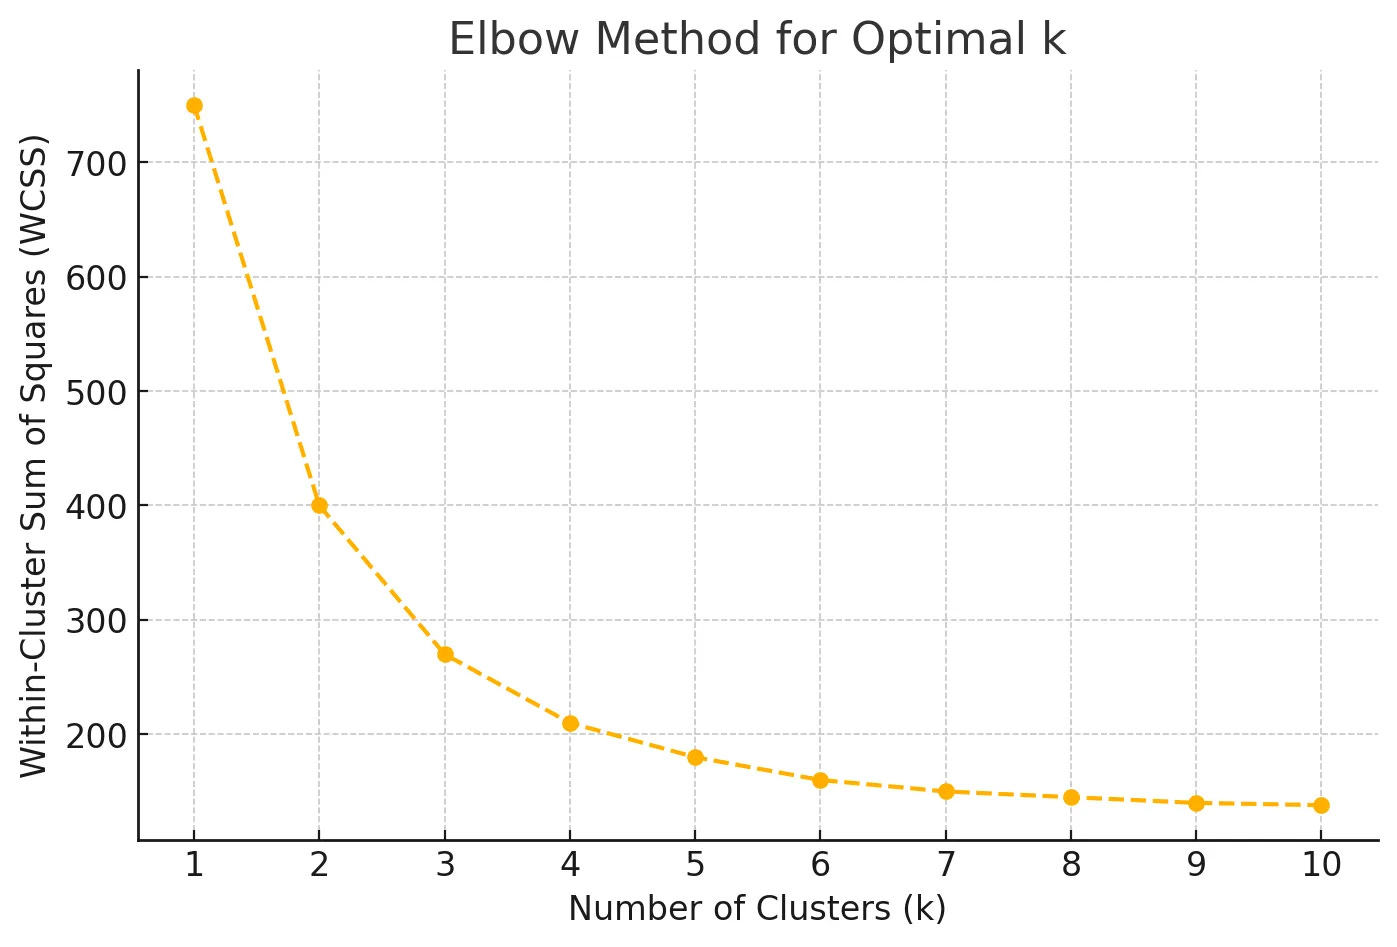
The Elbow Method is one of the most popular techniques for choosing k. It involves running the k-means algorithm for a range of k values (e.g., 1 to 10) and calculating the Within-Cluster Sum of Squares (WCSS) for each value of k.
The optimal k is typically chosen at the “elbow point” of the WCSS plot, where the reduction in WCSS slows significantly. This indicates that adding more clusters doesn’t substantially improve clustering quality, as the clusters are already compact.
The Silhouette Score
The Silhouette Score is another method for determining k by measuring how similar a data point is to its own cluster compared to other clusters.
The Silhouette Score ranges from -1 to 1, with higher values indicating that data points are well matched to their own cluster and poorly matched to neighboring clusters.
Remember that choosing the best k often involves iterating through several values and comparing the results using multiple methods. Combining metrics like the Elbow Method, Silhouette Score, and domain knowledge provides a well-rounded approach to determine the most effective k for a specific dataset.
Pros and Cons of K-means Clustering
K-means clustering is a popular choice for many clustering tasks due to its simplicity and speed. However, like any algorithm, it has both strengths and limitations. Understanding these can help in deciding when k-means is the right tool for the job and when it might be better to explore alternatives.
Pros
Simplicity and Ease of Implementation
K-means is straightforward to understand and easy to implement, even for those new to clustering.
Quick Convergence
The algorithm typically converges in just a few iterations, especially with optimized initial centroid selection methods like k-means++. This makes it a practical choice for real-time applications or those requiring rapid processing.
Interpretability of Results
The output of k-means clustering – a set of centroids and clusters – is easy to interpret.
Cons
Sensitivity to Initial Centroid Placement
K-means is highly dependent on the initial positions of the centroids. Poor initial centroid placement can lead to suboptimal clusters, local minima, or inconsistent results. Techniques like k-means++ mitigate this but cannot eliminate the issue entirely.
Assumption of Spherical Clusters
K-means works best when clusters are roughly spherical in shape. It assumes that clusters are isotropic (similar in all directions) and have similar sizes. For data with more complex or elongated cluster shapes, k-means may perform poorly.
Difficulty with Outliers
K-means is sensitive to outliers or extreme values because these points can distort the centroid positions, affecting the quality of clustering. Outliers may pull centroids away from the true cluster centers, leading to misclassification of data points.
When to Use K-means Clustering
K-means is most effective when the data has well-separated, spherical clusters, and there are no extreme outliers. It’s a good choice for applications requiring quick clustering solutions and those involving large, continuous data sets with relatively low dimensionality.
Thank you so much for tuning in Investor’s Edge today! Stay tuned for a step-by-step debrief on the specific code for a K-Means Clustering system for investors. While you wait, read about how to create your first algorithmic trading system below:
Remember to trade smart and stay sharp! Until next time!


