

Hello, readers! Welcome back to Investor’s Edge.
Starting with today’s article, I’ve decided to take a slightly different approach to the pieces I share on this platform. As I’ve made evident on this platform, I’ve always had a passion for the intersection of finance, AI, and code. To me, it's an electrifying bond where code translates raw volatility into evidence‑backed decisions. That drives me.
And, as I’ve been exploring these realms, I’ve discovered a serendipitous interest in Machine Learning. In my own words, Machine Learning is how Artificial Intelligence made its biggest mark in the coding sphere. It's a subset of machine intelligence that allows computers to learn and adapt from data - embodying qualities that can only be described as human. The concept of creating a model to function in the real world is astounding to me, and I’ve decided to take this fascination into my own hands.
The Genesis
For the last time being, my dictum has been:
At its heart, my model is a catalyst: it listens to markets in real time and empowers myself and others to invest in the future. I use this model to spotlight the opportunities that show that technology will help our species thrive.
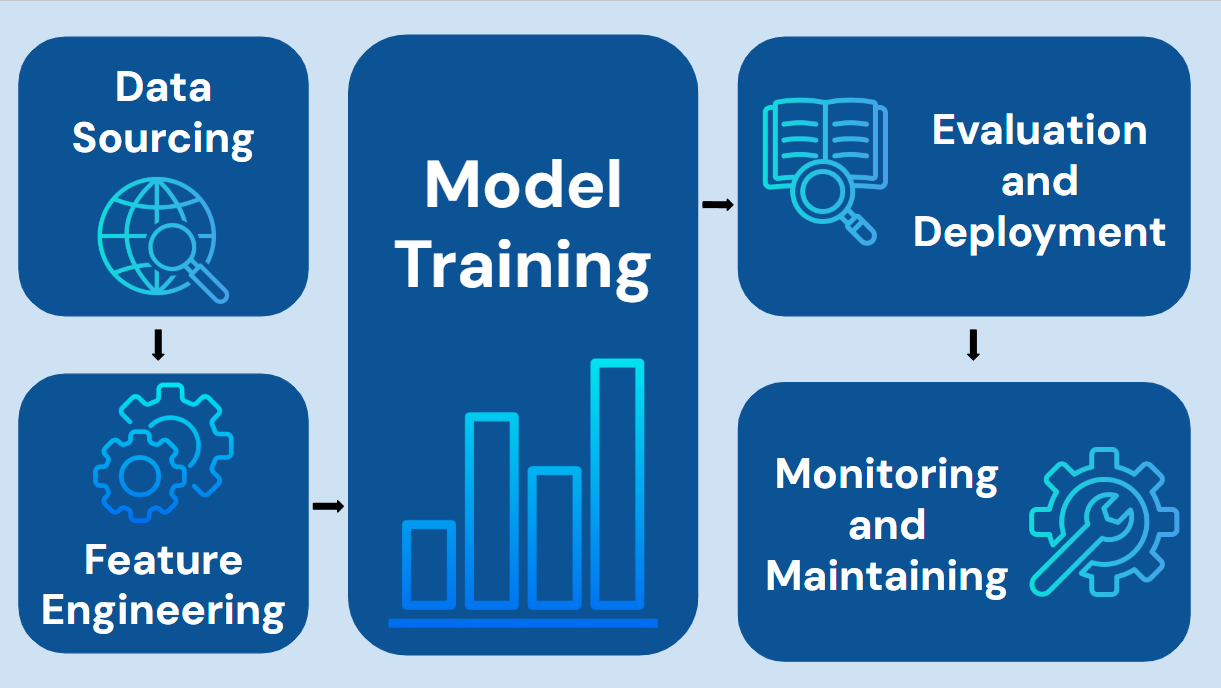
This model is meant to serve as a learning journey, so I’m excited to take you along with me. But, before we get too deep into the topic, let me explain the general synopsis of my ML model.
The program will consist of the supervised Random Forest strategy and logic to help the model operate the best it can. But, what does all that terminology mean?
Machine Learning models can be either supervised or unsupervised, and this (adjective, describing characteristic, possession of quality thingy) depends on the data. If the data given to the program is labeled, that means the model is predicting outputs based on supervised data. And thus, it is a supervised learning model. On the other hand, unsupervised logic feeds unlabeled data to the model, allowing it to discover hidden patterns and structures within it. Random Forest models run on supervised data.
The Random Forest logic is a ML algorithm meant to, at its core, mimic the branches and roots of a tree. Imagine you have a big pile of data, say about different fruits, and you want to predict if a new fruit is an apple, orange, or banana. This is your training data. Instead of giving the entire pile of data to one decision-maker, Random Forest creates many smaller, random piles of data, called "bootstrap samples". It does this by randomly picking data points from the original pile, with some points potentially being picked multiple times and some not picked at all.
For each of these mini-datasets, the Random Forest builds a separate "decision tree". This is where the “ensemble leaning” characteristic comes from - the model is an ensemble of smaller trees. Think of a decision tree like a flowchart. Each tree starts at a "root node" and asks questions about the fruit's features (e.g., "Is it red?", "Is it round?"). Based on the answers, it branches off, leading to more questions until it reaches a "leaf node" which represents a prediction, like "It's an apple". The key is that each tree doesn't consider all features when asking questions. It randomly picks only a subset of features to make its decisions. This ensures that each tree in the forest is unique and looks at the data from a different perspective.
These steps of creating a mini-dataset and building a decision tree are repeated many times, creating a whole "forest" of diverse decision trees.
This type of model learning intrigues me, and I hope it does the same for you. Let’s get into my experience so far.
The Fog
Predictably, the journey hasn’t been all sunshine and roses up to this point. So far, the hardest part of the experience has been figuring out which technical indicators were helpful and which ones weren’t. There are certain indicators that sound meaningful but are actually just echoes of more fundamental signals -or they simply don’t carry much information.
For instance, a series of “repeat” technical indicators are the simple‑moving‑average variants—such as the 20‑, 50‑, 100‑, and 200‑day SMAs. At first, it was unclear whether the benefit of including each of these lines was worth the risk of overwhelming the program. It’s clear to me now that the law of diminishing returns kicks in: piling on near‑duplicate features adds complexity faster than it adds insight.
Beyond this, the On‑Balance Volume (OBV) indicator initially seemed like it carried lots of value, but feature‑importance testing showed its signal was almost perfectly collinear with basic volume and price‑change data. This means it introduced noise without boosting accuracy. Streamlining it out keeps the model lean, interpretable, and faster to retrain.
What’s Next
Over the coming months I’ll keep tracking the journey that shapes this machine-learning adventure. My goal is to give you an honest view of how ideas evolve into code. If you’ve ever been curious about the crossroads of finance, AI, and real-world data, now’s the perfect time to dive in.
Where to Find Me
Weekly Substack articles:
on SubstackQuick hits & threads on X: @edgeofinvesting
Project snapshots on Instagram: @lera_byte
Professional updates on LinkedIn: Lera Andronova
Hit Subscribe, share this article to your friends, and join me as we learn how tomorrow’s markets are being written today’s code.
Until next time, stay sharp and trade smart! Bye!